Introduction to Cardiac Mechanics
The human heart is not just a pump—it’s a powerful biomechanical engine. With each beat, it consumes energy to contract, relax, and move blood throughout the body. This energy isn’t just a number; it reflects how healthy the heart is, how hard it’s working, and whether it’s operating efficiently.
But when it comes to quantifying this mechanical work, two commonly referenced terms arise: End-Diastolic Volume (EDV) and Pressure-Volume Area (PVA). These two markers measure entirely different aspects of cardiac function. EDV speaks to how much blood fills the heart; PVA tells us how much work the heart actually performs. Let’s dive into their differences—and understand why PVA is considered a better metric for assessing total mechanical work.
Understanding EDV (End-Diastolic Volume)
What is EDV?
EDV is the volume of blood present in the left ventricle at the end of diastole—right before it contracts. It represents the heart’s preload or how “stretched” the muscle fibers are before contraction begins.
Role in Preload and Stroke Volume
As a determinant of preload, EDV affects stroke volume through the Frank-Starling mechanism—the more the heart fills, the more it can pump out. However, this relationship is nonlinear and plateaus when overstretching occurs.
How EDV is Measured
EDV is typically measured using echocardiography, MRI, or conductance catheterization. While it provides valuable information about filling pressures and volume status, it doesn’t quantify mechanical work.
EDV in Health and Disease
In healthy hearts, EDV varies based on hydration, posture, and exercise. In diseases like dilated cardiomyopathy, EDV increases due to ventricular dilation, but the mechanical efficiency of the heart may be poor—highlighting its limitations as a standalone metric.
The Concept of Stroke Work (SW)
What Stroke Work Represents
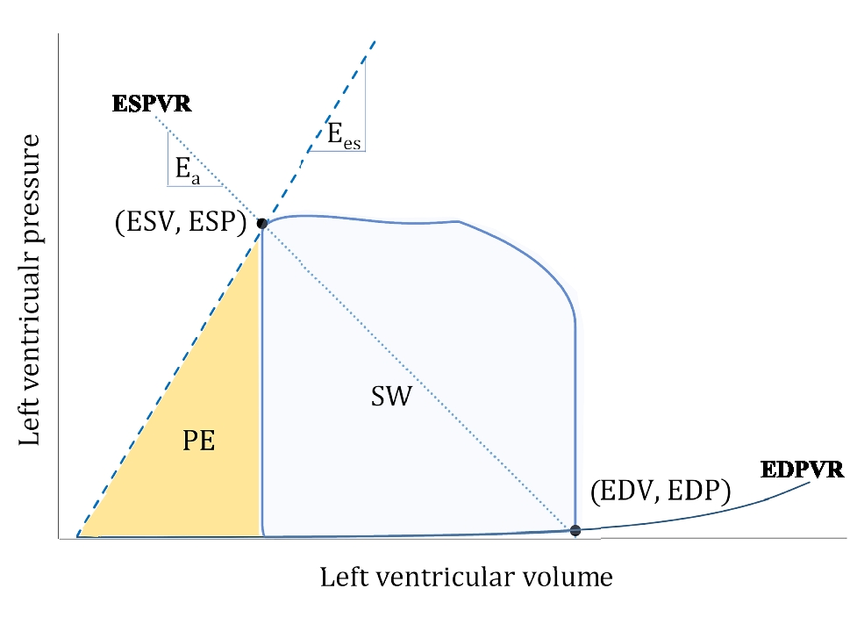
Stroke work is the actual work the heart does to eject blood during systole. It’s represented as the area inside the pressure-volume loop, a closed figure plotted by tracking changes in pressure and volume throughout the cardiac cycle.
SW and PV Loop Area
This internal area correlates with how much energy the heart expends to move blood, but it doesn’t include the energy stored in the heart muscle (potential energy).
SW Limitations
While it reflects active pumping, stroke work doesn’t account for all energy expenditures—especially those that don’t result in ejected blood but still stress the heart muscle.
Introduction to Potential Energy (PE)
Definition and Significance
Potential energy in cardiac terms is the stored elastic energy in the myocardium during contraction that isn’t used to pump blood. It reflects tension and strain within the heart.
PE on PV Loop
It’s the triangular area bounded above by the end-systolic pressure-volume relationship (ESPVR) and below by the actual PV loop.
Energy That Doesn’t Become Motion
This component is crucial in understanding total heart workload. Although this energy doesn’t directly contribute to moving blood, it’s still part of the mechanical burden on the heart.
What is Pressure-Volume Area (PVA)?
PVA as Total Mechanical Energy
PVA is the sum of stroke work and potential energy. It represents the entire amount of mechanical energy generated during a heartbeat.
PVA = SW + PE
This formula means that PVA captures both the work used to eject blood (SW) and the effort retained as tension (PE).
How PVA is Calculated
PVA can be calculated most accurately using conductance catheter-based measurements by analyzing the complete PV loop, ESPVR, and pressure traces.
Comparing PVA vs EDV
Mechanical Energy vs Preload Volume
EDV is a volume marker. It tells us how much blood the ventricle receives. But it says nothing about how much effort the heart exerts. PVA, however, directly reflects mechanical work and oxygen demand.
Which is More Meaningful?
For clinicians assessing energy consumption, contractility, or evaluating treatment responses, PVA is far more valuable.
Differences in Diagnostic Utility
| Metric | Reflects | Clinical Usefulness |
| EDV | Preload/filling volume | Fluid status, ventricular dilation |
| PVA | Total mechanical work | Cardiac workload, oxygen demand, efficiency |
Visualization Through Pressure-Volume Loops
PV loops are graphical depictions of the cardiac cycle. Here’s how the components look:
- EDV: Rightmost point of the loop (end diastole)
- ESV: Leftmost point (end systole)
- SW: Enclosed area of the loop
- PE: Area above loop and under ESPVR
- PVA: Total area under ESPVR (SW + PE)
This visualization helps identify changes in heart performance, preload, afterload, and energy expenditure in real-time.
Myocardial Oxygen Consumption (MVO₂) and PVA
Linear Relationship of PVA and MVO₂
One of the most significant findings in cardiac physiology is the strong linear relationship between PVA and myocardial oxygen consumption (MVO₂). Simply put, as the heart performs more mechanical work (increased PVA), it consumes more oxygen.
This correlation is key in understanding why PVA is a superior metric over EDV. While EDV doesn’t account for energy output, PVA directly predicts how much metabolic fuel the heart is burning.
How Oxygen Demand Reflects Mechanical Work
Oxygen is essential for the production of ATP, the energy currency used by cardiac muscle fibers to contract and relax. An increase in PVA signals a proportional rise in ATP demand, which in turn requires more oxygen. Thus, PVA serves as a proxy for real-time energetic demands.
Clinical Insight
This relationship enables clinicians to estimate oxygen requirements of the heart under various conditions such as stress, disease, or during interventions. For example, in patients with ischemic heart disease, minimizing PVA can help reduce oxygen consumption and protect the myocardium from further damage.
Ventricular-Arterial Coupling and Efficiency
Role of PVA in Efficiency
Efficiency in cardiac function is often measured as the ratio of stroke work (SW) to PVA:

This ratio indicates how effectively the heart converts chemical energy into mechanical motion. A high ratio suggests good efficiency, while a low ratio implies energy is being wasted, either through increased potential energy or poor contractility.
SW/PVA Ratio
In healthy individuals, this ratio hovers around 0.7 to 0.8. In heart failure patients, however, the ratio often drops significantly, signaling that more energy is being consumed for less effective output.
Implications for Heart Performance
Ventricular-arterial coupling—how the heart and vascular system interact—can also be assessed through PVA. It reflects how well the heart’s output matches systemic resistance. Poor coupling leads to increased energy demands and lower efficiency.
EDV vs PVA in Heart Disease
Dilated Cardiomyopathy
In dilated cardiomyopathy (DCM), EDV increases as the ventricles stretch. But even with a larger filling volume, stroke work often decreases due to poor contractility. Here, EDV is misleading—suggesting a full ventricle but not accounting for poor mechanical performance. PVA, on the other hand, shows both decreased SW and increased PE, highlighting inefficiency.
Heart Failure with Preserved Ejection Fraction (HFpEF)
In HFpEF, EDV might remain normal or even reduced, but patients still experience high filling pressures and poor cardiac output. PVA captures these nuanced energy dynamics better than EDV, especially under stress.
How PVA Guides Treatment Better
Whether it’s titrating beta-blockers, adjusting fluid management, or evaluating mechanical support, PVA provides real-time insight into how much strain the heart is under—something EDV alone cannot reveal.
Technological Advances in Measuring PVA
Invasive Methods
Traditionally, calculating PVA requires cardiac catheterization with pressure and volume sensors. This method is still the gold standard.
Non-Invasive Imaging
Modern advancements now allow for PVA estimation through echocardiography, cardiac MRI, and 3D imaging. These technologies can simulate PV loops and calculate stroke work and potential energy.
Real-Time Monitoring
Wearable devices and implantable monitors are also being explored for continuous PVA tracking in high-risk cardiac patients, potentially transforming outpatient care.
Role in Mechanical Circulatory Support (VADs/Impella)
Reducing SW and PE
When a mechanical circulatory support device like an Impella or Ventricular Assist Device (VAD) is used, it offloads the ventricle. This reduces both stroke work and potential energy, leading to a lower PVA and decreased oxygen demand.
PVA Changes with Support
By monitoring PVA, clinicians can titrate device output to strike a balance between unloading the heart and maintaining adequate perfusion. It’s a precise way to measure myocardial rest and recovery.
Heart Recovery Evaluation
PVA trends over time help determine whether the native heart is improving and can potentially be weaned off support. This is especially useful in bridge-to-recovery scenarios.
Exercise, Stress, and PVA
Cardiac Energetics During Physical Exertion
During exercise, the heart’s energy demands skyrocket. PVA increases significantly, not just because of increased stroke volume but also due to elevated pressure and rate.
Monitoring PVA in Athletes
For elite athletes, PVA can help track training intensity and recovery. If PVA remains high post-exercise, it may suggest inadequate recovery or overtraining, offering a new frontier in sports cardiology.
PVA and Drug Interventions
Beta Blockers
These medications lower heart rate and contractility, reducing both stroke work and potential energy—hence lowering PVA and oxygen consumption.
Inotropes
Drugs like dobutamine increase contractility, raising both SW and PVA. Monitoring this helps ensure that benefits (increased output) don’t outweigh risks (increased oxygen demand).
How Medications Affect SW, PE, and PVA
Adjusting drug therapy based on PVA can lead to more tailored and effective cardiac care, especially in heart failure management.
Summary Table of Key Differences
| Feature | EDV | SW | PE | PVA |
| What it measures | Preload volume | Pump work | Stored energy | Total mechanical energy |
| Unit | mL | mmHg·mL | mmHg·mL | mmHg·mL |
| Seen on PV loop | Rightmost point | Area within loop | Area above loop | Entire area under ESPVR |
| Reflects oxygen use? | ❌ No | ✅ Partially | ✅ Partially | ✅ Fully |
| Affected by afterload? | ❌ No | ✅ Yes | ✅ Yes | ✅ Yes |
| Clinical usefulness | Volume status | Output estimation | Energy retention | Overall cardiac workload |
Frequently Asked Questions (FAQs)
1. Is EDV the same as preload?
Not exactly. EDV is one way to estimate preload, but true preload also involves myocardial stretch and compliance.
2. Why is PVA a better measure of cardiac work than EDV?
PVA includes both the work done (SW) and energy stored (PE), offering a complete view of heart workload, while EDV only reflects filling volume.
3. How does PVA correlate with oxygen consumption?
Very closely. PVA has a linear relationship with myocardial oxygen consumption, making it a reliable marker of cardiac energy use.
4. Is PVA useful in heart failure management?
Absolutely. PVA helps guide therapy, assess mechanical efficiency, and evaluate recovery or response to treatment.
5. What’s a good SW/PVA ratio?
A ratio of 0.7–0.8 indicates good mechanical efficiency. Lower values may suggest energy waste or ventricular dysfunction.
Conclusion
In the debate of total mechanical work PVA vs EDV, the winner is clear: PVA offers a far more comprehensive and clinically useful measurement. While EDV helps understand volume dynamics, it misses the energetic burden and real performance of the heart.
Whether you’re a clinician, researcher, or student of cardiology, understanding PVA is essential to mastering modern cardiovascular mechanics.