Cardiac Resynchronization Therapy (CRT)

Cardiac Resynchronization Therapy (CRT), involves placing several electrodes in the heart to synchronize a dyssynchronous heart chamber. According to the Ottawa Heart Institute, only 50% of patients respond positively to CRT treatment, based on evidence of reverse remodeling characterized by a 15% decrease in left ventricular (LV) end systolic volume (ESV).5 Furthermore, in 16% of cases treated with CRT, a patient’s condition worsens as demonstrated by the PROSPECT study.2 Pacing at the wrong lead location can cause an immediate increase in intra-ventricular dyssynchrony.
Several approaches have attempted to improve patient response by using echocardiographic guidance or hemodynamic feedback from a pressure sensor (+dP/dt max) to test different pacemaker settings. To date, those attempts have been unsuccessful.2,3,4
The positioning of the pacing electrodes can vary considerably from patient to patient. The best lead positions are those that yield an acute improvement in pump function as determined by LV pressure-volume (PV) loop analysis.5,9,10,11 It has been demonstrated that acute hemodynamic improvements correlated with the positive response to CRT due to the strong predictive power of the PV relationship.7,8,9 With guidance from intracardiac PV measurements, positive CRT response rates increased significantly (up to 77% positive responders) based on reverse remodeling.
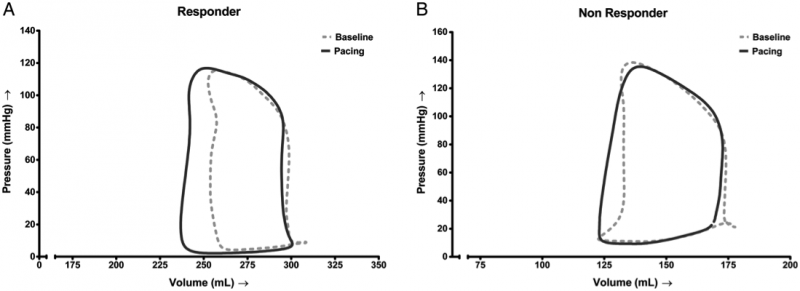
Pressure–volume loops of two different patients during baseline (dotted) and during biventricular pacing (solid line).
Figure A shows substantial acute change in a long-term responder. Figure B shows negligible acute change in a long-term non-responder.8
Quotes from literature
- “Stroke work, but not LV dP/dtmax, is consistently associated with long-term prognosis and response after CRT. Our results therefore favor the use of LV stroke work as the hemodynamic parameter to predict long-term outcome after CRT”1
- “The major finding of the study is the clear association of acute pump function improvement with reverse remodelling after 6 months of CRT. Furthermore, the data strongly suggest that acute stroke work (SW) improvement predicts long term response to CRT more accurately as compared with other invasively measured variables such as dP/dtmax.”8
- “In the present study, a 71% long-term response rate was observed in the overall population, whereas the response rate would rise to a substantial 77%, if the ‘narrow’ QRS (<120 ms) patients were to be excluded.”8
- “The strong predictive power of the PV loop measurements as shown in this study, could allow a strategy in which CRT would be denied to patients who do not show a significant PV loop response.”9
- “This approach may have important additional value in subsets of patients in whom there is less consensus for a clinical benefit, i.e. patients with right bundle branch block, intraventricular conduction delay, or narrow QRS.”9
- ”PV loop measurements could also be performed to optimize the LV lead position which has been shown to improve response to CRT.”9
- “This approach may particularly benefit patients with ischaemic cardiomyopathy, in whom implantation of the LV lead at areas with myocardial scar has been shown to reduce CRT effectiveness, de Roest et al. performed PV loop-guided lead position optimization and observed a considerably higher response rate compared with those reported in the literature.”9
By adopting PV loops in standard clinical practice to guide CRT, the potential impact on cost savings is significant.
These cost savings are based on:
- Sixteen percent of patients indicated for CRT show hemodynamic worsening by BiV pacing revealed by the PV technique. In such cases no pacemaker is implanted, resulting in direct cost savings by removing the material expense of the pacemaker.2,8,9
- The percentage of patients responding to CRT may improve from 50% up to 80%. The non-responder group, post implant, falls back on conventional treatment with frequent hospitalizations. As such, improvements in response rate constitute indirect savings.7,8,9 Also, benefits of CRT in the positive responder group may be further improved by the PV guided lead positioning contributing to the indirect savings.9
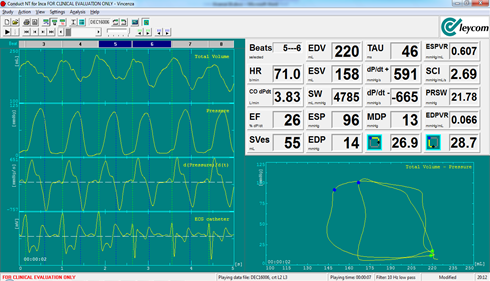
Above is a screenshot of the Inca interface. At the end of beat 5, LV pacing is started at an optimal electrode positioning with multi-point stimulation, resulting in immediate increase of SV and SW by leftward shift of the ESPV point at similar preload.
Waveforms on the left (top to bottom): LV Volume, LV Pressure, continuous dP/dt and ECG.
Related publications.
- 2023; LV Stroke Work Outperforms dP/dtmax During Cardiac Resynchronizaton Therapy: https://pubmed.ncbi.nlm.nih.gov/38204465/
- 2019; CRT Optimization using PV Loop Hemodynamics: https://pubmed.ncbi.nlm.nih.gov/31537329/
- 2013; Prediction of long-term Outcomes of CRT by Acute PV loop Optimization: https://pubmed.ncbi.nlm.nih.gov/23183349/
- 2006; PV Loop Analysis of long-term CRT: https://pubmed.ncbi.nlm.nih.gov/16520415/
- 2006; Ventricular pacing lead location alters systemic hemodynamics and LV function with and without reduced ejection fraction: https://pubmed.ncbi.nlm.nih.gov/17045900/